ТОП просматриваемых книг сайта:
Математика
Различные книги в жанре Математика, доступные для чтения и скачиванияАннотация
Autoregressive Conditional Heteroskedastic (ARCH) processes are used in finance to model asset price volatility over time. This book introduces both the theory and applications of ARCH models and provides the basic theoretical and empirical background, before proceeding to more advanced issues and applications. The Authors provide coverage of the recent developments in ARCH modelling which can be implemented using econometric software, model construction, fitting and forecasting and model evaluation and selection. Key Features: Presents a comprehensive overview of both the theory and the practical applications of ARCH, an increasingly popular financial modelling technique. Assumes no prior knowledge of ARCH models; the basics such as model construction are introduced, before proceeding to more complex applications such as value-at-risk, option pricing and model evaluation. Uses empirical examples to demonstrate how the recent developments in ARCH can be implemented. Provides step-by-step instructive examples, using econometric software, such as Econometric Views and the G@RCH module for the Ox software package, used in Estimating and Forecasting ARCH Models. Accompanied by a CD-ROM containing links to the software as well as the datasets used in the examples. Aimed at readers wishing to gain an aptitude in the applications of financial econometric modelling with a focus on practical implementation, via applications to real data and via examples worked with econometrics packages.
Аннотация
A comprehensive guide to statistical hypothesis testing with examples in SAS and R When analyzing datasets the following questions often arise: Is there a short hand procedure for a statistical test available in SAS or R? If so, how do I use it? If not, how do I program the test myself? This book answers these questions and provides an overview of the most common statistical test problems in a comprehensive way, making it easy to find and perform an appropriate statistical test. A general summary of statistical test theory is presented, along with a basic description for each test, including the necessary prerequisites, assumptions, the formal test problem and the test statistic. Examples in both SAS and R are provided, along with program code to perform the test, resulting output and remarks explaining the necessary program parameters. Key features: • Provides examples in both SAS and R for each test presented. • Looks at the most common statistical tests, displayed in a clear and easy to follow way. • Supported by a supplementary website http://www.d-taeger.de featuring example program code. Academics, practitioners and SAS and R programmers will find this book a valuable resource. Students using SAS and R will also find it an excellent choice for reference and data analysis.
Аннотация
Spatial and Spatio-Temporal Bayesian Models with R-INLA provides a much needed, practically oriented & innovative presentation of the combination of Bayesian methodology and spatial statistics. The authors combine an introduction to Bayesian theory and methodology with a focus on the spatial and spatio-temporal models used within the Bayesian framework and a series of practical examples which allow the reader to link the statistical theory presented to real data problems. The numerous examples from the fields of epidemiology, biostatistics and social science all are coded in the R package R-INLA, which has proven to be a valid alternative to the commonly used Markov Chain Monte Carlo simulations
Аннотация
The presentation of a novel theory in orthogonal regression The literature about neural-based algorithms is often dedicated to principal component analysis (PCA) and considers minor component analysis (MCA) a mere consequence. Breaking the mold, Neural-Based Orthogonal Data Fitting is the first book to start with the MCA problem and arrive at important conclusions about the PCA problem. The book proposes several neural networks, all endowed with a complete theory that not only explains their behavior, but also compares them with the existing neural and traditional algorithms. EXIN neurons, which are of the authors' invention, are introduced, explained, and analyzed. Further, it studies the algorithms as a differential geometry problem, a dynamic problem, a stochastic problem, and a numerical problem. It demonstrates the novel aspects of its main theory, including its applications in computer vision and linear system identification. The book shows both the derivation of the TLS EXIN from the MCA EXIN and the original derivation, as well as: Shows TLS problems and gives a sketch of their history and applications Presents MCA EXIN and compares it with the other existing approaches Introduces the TLS EXIN neuron and the SCG and BFGS acceleration techniques and compares them with TLS GAO Outlines the GeTLS EXIN theory for generalizing and unifying the regression problems Establishes the GeMCA theory, starting with the identification of GeTLS EXIN as a generalization eigenvalue problem In dealing with mathematical and numerical aspects of EXIN neurons, the book is mainly theoretical. All the algorithms, however, have been used in analyzing real-time problems and show accurate solutions. Neural-Based Orthogonal Data Fitting is useful for statisticians, applied mathematics experts, and engineers.
Аннотация
A highly valued resource for those who wish to move from the introductory and preliminary understandings and the measurement of chaotic behavior to a more sophisticated and precise understanding of chaotic systems. The authors provide a deep understanding of the structure of strange attractors, how they are classified, and how the information required to identify and classify a strange attractor can be extracted from experimental data. In its first edition, the Topology of Chaos has been a valuable resource for physicist and mathematicians interested in the topological analysis of dynamical systems. Since its publication in 2002, important theoretical and experimental advances have put the topological analysis program on a firmer basis. This second edition includes relevant results and connects the material to other recent developments. Following significant improvements will be included: * A gentler introduction to the topological analysis of chaotic systems for the non expert which introduces the problems and questions that one commonly encounters when observing a chaotic dynamics and which are well addressed by a topological approach: existence of unstable periodic orbits, bifurcation sequences, multistability etc. * A new chapter is devoted to bounding tori which are essential for achieving generality as well as for understanding the influence of boundary conditions. * The new edition also reflects the progress which had been made towards extending topological analysis to higher-dimensional systems by proposing a new formalism where evolving triangulations replace braids. * There has also been much progress in the understanding of what is a good representation of a chaotic system, and therefore a new chapter is devoted to embeddings. * The chapter on topological analysis program will be expanded to cover traditional measures of chaos. This will help to connect those readers who are familiar with those measures and tests to the more sophisticated methodologies discussed in detail in this book. * The addition of the Appendix with both frequently asked and open questions with answers gathers the most essential points readers should keep in mind and guides to corresponding sections in the book. This will be of great help to those who want to selectively dive into the book and its treatments rather than reading it cover to cover. What makes this book special is its attempt to classify real physical systems (e.g. lasers) using topological techniques applied to real date (e.g. time series). Hence it has become the experimenter?s guidebook to reliable and sophisticated studies of experimental data for comparison with candidate relevant theoretical models, inevitable to physicists, mathematicians, and engineers studying low-dimensional chaotic systems.
Аннотация
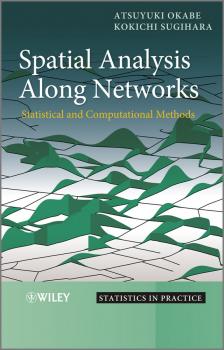
In the real world, there are numerous and various events that occur on and alongside networks, including the occurrence of traffic accidents on highways, the location of stores alongside roads, the incidence of crime on streets and the contamination along rivers. In order to carry out analyses of those events, the researcher needs to be familiar with a range of specific techniques. Spatial Analysis Along Networks provides a practical guide to the necessary statistical techniques and their computational implementation. Each chapter illustrates a specific technique, from Stochastic Point Processes on a Network and Network Voronoi Diagrams, to Network K-function and Point Density Estimation Methods, and the Network Huff Model. The authors also discuss and illustrate the undertaking of the statistical tests described in a Geographical Information System (GIS) environment as well as demonstrating the user-friendly free software package SANET. Spatial Analysis Along Networks: Presents a much-needed practical guide to statistical spatial analysis of events on and alongside a network, in a logical, user-friendly order. Introduces the preliminary methods involved, before detailing the advanced, computational methods, enabling the readers a complete understanding of the advanced topics. Dedicates a separate chapter to each of the major techniques involved. Demonstrates the practicalities of undertaking the tests described in the book, using a GIS. Is supported by a supplementary website, providing readers with a link to the free software package SANET, so they can execute the statistical methods described in the book. Students and researchers studying spatial statistics, spatial analysis, geography, GIS, OR, traffic accident analysis, criminology, retail marketing, facility management and ecology will benefit from this book.
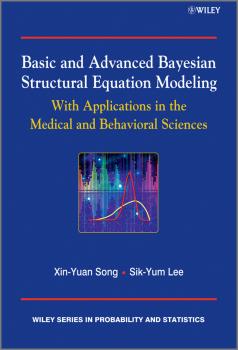
Basic and Advanced Bayesian Structural Equation Modeling. With Applications in the Medical and Behavioral Sciences - Song Xin-Yuan
Аннотация
This book provides clear instructions to researchers on how to apply Structural Equation Models (SEMs) for analyzing the inter relationships between observed and latent variables. Basic and Advanced Bayesian Structural Equation Modeling introduces basic and advanced SEMs for analyzing various kinds of complex data, such as ordered and unordered categorical data, multilevel data, mixture data, longitudinal data, highly non-normal data, as well as some of their combinations. In addition, Bayesian semiparametric SEMs to capture the true distribution of explanatory latent variables are introduced, whilst SEM with a nonparametric structural equation to assess unspecified functional relationships among latent variables are also explored. Statistical methodologies are developed using the Bayesian approach giving reliable results for small samples and allowing the use of prior information leading to better statistical results. Estimates of the parameters and model comparison statistics are obtained via powerful Markov Chain Monte Carlo methods in statistical computing. Introduces the Bayesian approach to SEMs, including discussion on the selection of prior distributions, and data augmentation. Demonstrates how to utilize the recent powerful tools in statistical computing including, but not limited to, the Gibbs sampler, the Metropolis-Hasting algorithm, and path sampling for producing various statistical results such as Bayesian estimates and Bayesian model comparison statistics in the analysis of basic and advanced SEMs. Discusses the Bayes factor, Deviance Information Criterion (DIC), and $L_\nu$-measure for Bayesian model comparison. Introduces a number of important generalizations of SEMs, including multilevel and mixture SEMs, latent curve models and longitudinal SEMs, semiparametric SEMs and those with various types of discrete data, and nonparametric structural equations. Illustrates how to use the freely available software WinBUGS to produce the results. Provides numerous real examples for illustrating the theoretical concepts and computational procedures that are presented throughout the book. Researchers and advanced level students in statistics, biostatistics, public health, business, education, psychology and social science will benefit from this book.
Аннотация
The increasing availability of data in our current, information overloaded society has led to the need for valid tools for its modelling and analysis. Data mining and applied statistical methods are the appropriate tools to extract knowledge from such data. This book provides an accessible introduction to data mining methods in a consistent and application oriented statistical framework, using case studies drawn from real industry projects and highlighting the use of data mining methods in a variety of business applications. Introduces data mining methods and applications. Covers classical and Bayesian multivariate statistical methodology as well as machine learning and computational data mining methods. Includes many recent developments such as association and sequence rules, graphical Markov models, lifetime value modelling, credit risk, operational risk and web mining. Features detailed case studies based on applied projects within industry. Incorporates discussion of data mining software, with case studies analysed using R. Is accessible to anyone with a basic knowledge of statistics or data analysis. Includes an extensive bibliography and pointers to further reading within the text. Applied Data Mining for Business and Industry, 2nd edition is aimed at advanced undergraduate and graduate students of data mining, applied statistics, database management, computer science and economics. The case studies will provide guidance to professionals working in industry on projects involving large volumes of data, such as customer relationship management, web design, risk management, marketing, economics and finance.
Аннотация
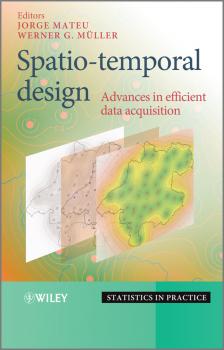
A state-of-the-art presentation of optimum spatio-temporal sampling design – bridging classic ideas with modern statistical modeling concepts and the latest computational methods. Spatio-temporal Design presents a comprehensive state-of-the-art presentation combining both classical and modern treatments of network design and planning for spatial and spatio-temporal data acquisition. A common problem set is interwoven throughout the chapters, providing various perspectives to illustrate a complete insight to the problem at hand. Motivated by the high demand for statistical analysis of data that takes spatial and spatio-temporal information into account, this book incorporates ideas from the areas of time series, spatial statistics and stochastic processes, and combines them to discuss optimum spatio-temporal sampling design. Spatio-temporal Design: Advances in Efficient Data Acquisition: Provides an up-to-date account of how to collect space-time data for monitoring, with a focus on statistical aspects and the latest computational methods Discusses basic methods and distinguishes between design and model-based approaches to collecting space-time data. Features model-based frequentist design for univariate and multivariate geostatistics, and second-phase spatial sampling. Integrates common data examples and case studies throughout the book in order to demonstrate the different approaches and their integration. Includes real data sets, data generating mechanisms and simulation scenarios. Accompanied by a supporting website featuring R code. Spatio-temporal Design presents an excellent book for graduate level students as well as a valuable reference for researchers and practitioners in the fields of applied mathematics, engineering, and the environmental and health sciences.
Аннотация
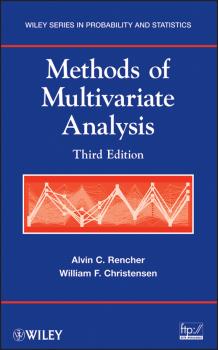
Praise for the Second Edition «This book is a systematic, well-written, well-organized text on multivariate analysis packed with intuition and insight . . . There is much practical wisdom in this book that is hard to find elsewhere.» —IIE Transactions Filled with new and timely content, Methods of Multivariate Analysis, Third Edition provides examples and exercises based on more than sixty real data sets from a wide variety of scientific fields. It takes a «methods» approach to the subject, placing an emphasis on how students and practitioners can employ multivariate analysis in real-life situations. This Third Edition continues to explore the key descriptive and inferential procedures that result from multivariate analysis. Following a brief overview of the topic, the book goes on to review the fundamentals of matrix algebra, sampling from multivariate populations, and the extension of common univariate statistical procedures (including t-tests, analysis of variance, and multiple regression) to analogous multivariate techniques that involve several dependent variables. The latter half of the book describes statistical tools that are uniquely multivariate in nature, including procedures for discriminating among groups, characterizing low-dimensional latent structure in high-dimensional data, identifying clusters in data, and graphically illustrating relationships in low-dimensional space. In addition, the authors explore a wealth of newly added topics, including: Confirmatory Factor Analysis Classification Trees Dynamic Graphics Transformations to Normality Prediction for Multivariate Multiple Regression Kronecker Products and Vec Notation New exercises have been added throughout the book, allowing readers to test their comprehension of the presented material. Detailed appendices provide partial solutions as well as supplemental tables, and an accompanying FTP site features the book's data sets and related SAS® code. Requiring only a basic background in statistics, Methods of Multivariate Analysis, Third Edition is an excellent book for courses on multivariate analysis and applied statistics at the upper-undergraduate and graduate levels. The book also serves as a valuable reference for both statisticians and researchers across a wide variety of disciplines.

